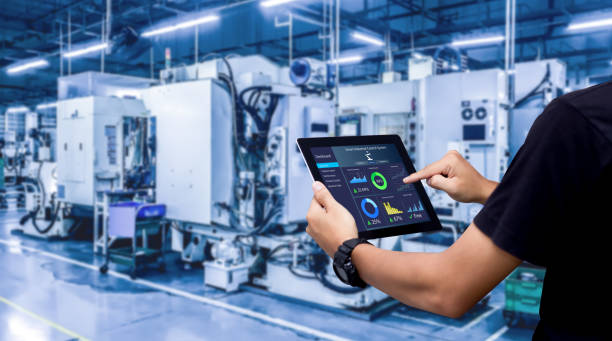
Optimizing throughput with real-time operational dashboards
Real-time operational dashboards consolidate live analytics, sensor telemetry, and process indicators to make throughput visible across production lines. By combining monitoring, predictive models, and clear visualizations, teams can detect anomalies, prioritize maintenance, and align automation to preserve yield and quality. This overview explains how dashboards support root-cause analysis and continuous optimization in industrial operations.

How does analytics and monitoring improve throughput?
Real-time analytics and monitoring turn raw telemetry into actionable insights that directly affect throughput. Dashboards aggregate performance metrics such as cycle time, tool utilization, and queue lengths so operators and managers can spot bottlenecks quickly. Presenting trends, not just snapshots, enables data-informed decisions about staffing, line balancing, or short-term scheduling adjustments. When monitoring integrates historical context and current state, analytics highlight patterns that correlate with lower yield or slower throughput, helping teams prioritize interventions that preserve production capacity without guessing.
How do sensors and telemetry feed real-time dashboards?
Sensors and telemetry are the data foundation for operational dashboards. Flow meters, vibration sensors, temperature probes, and PLC signals capture machine and process states and stream them into data buses or edge gateways. Telemetry pipelines normalize and timestamp this data so dashboards reflect synchronized conditions across equipment and shifts. Reliable sensor coverage and robust telemetry reduce blind spots, enabling dashboards to present a coherent view of line performance. This near-instant visibility supports quicker responses to deviations and improves the accuracy of throughput estimates.
How can predictive maintenance reduce downtime?
Predictive approaches use monitored signals and analytics to estimate when components will fail or degrade, reducing unplanned downtime that erodes throughput. Dashboards that surface predictive alerts help maintenance teams schedule repairs during planned windows or perform targeted part replacements before failures occur. Combining condition data with failure history refines the predictive models and reduces false positives. Over time, fewer unexpected stoppages mean steady output, higher effective equipment availability, and a more reliable production cadence that supports throughput goals.
How does anomaly detection reveal root cause issues?
Automated anomaly detection highlights unusual patterns in telemetry and quality metrics that human operators might miss. When a dashboard flags a deviation—an unexpected vibration spike, a drop in yield, or a shift in cycle time—teams can use correlated telemetry to trace probable root causes. Visual correlations between sensor data, process steps, and quality outcomes accelerate root-cause analysis and reduce the time spent chasing symptoms. Structured anomaly alerts support consistent incident workflows and improve the speed at which throughput-impacting issues are resolved.
How can digital twin and automation support optimization?
Digital twin models mirror a production asset or line and allow scenario testing without disrupting operations. Coupling a digital twin with live telemetry on the dashboard lets planners simulate control changes, layout tweaks, or different batch schedules to estimate throughput and quality outcomes. When automation systems are integrated, dashboards can present both recommended actions and the status of automated adjustments, ensuring optimization happens safely. This combination of modeling and real-time control supports faster, evidence-based changes that boost throughput while protecting quality and yield.
How do dashboards track yield and quality in operations?
Dashboards link throughput metrics with quality and yield indicators so teams understand trade-offs between speed and output integrity. Visual KPIs for scrap rates, first-pass yield, and defect types should be presented alongside throughput and cycle-time data to reveal when increased speed is causing quality reduction. Trend charts and filters by product, shift, or line segment help isolate conditions associated with lower yield. Integrating quality alerts into the same dashboard ensures corrective actions are considered in the same context as throughput optimization, preserving long-term efficiency.
Conclusion Real-time operational dashboards provide a unified environment to monitor throughput, detect anomalies, and coordinate predictive maintenance and automation. By combining sensor telemetry, analytics, and context-rich visualizations—including digital twin simulations—teams can shorten root-cause resolution cycles and make throughput improvements that do not compromise quality or yield. Consistent use of dashboards helps operations move from reactive firefighting to measured optimization and steady production performance.


