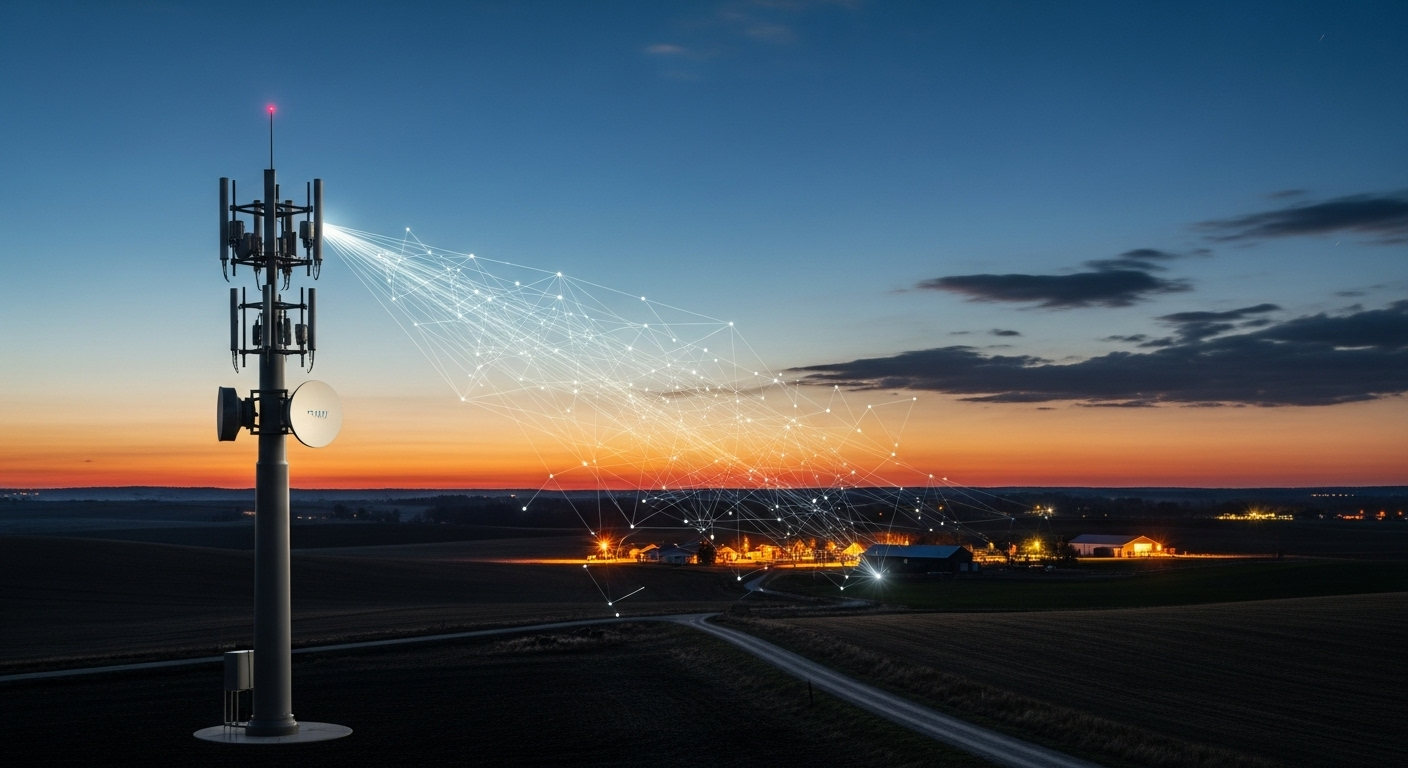
Measuring service quality: metrics for real-world connectivity
Reliable service quality measurement ties technical metrics to user experience across fixed and wireless networks. This article outlines practical indicators for assessing broadband, fiber, satellite and 5G connectivity, and explains how latency, coverage, backhaul and infrastructure choices influence real-world performance for both urban and rural users.

Real-world connectivity assessment requires clear, repeatable metrics that reflect what end users actually experience. Measurements should combine objective network data with subjective user-impact indicators: throughput, latency, jitter, packet loss, and availability alongside application-level success rates (web page load, video stream stability, VoIP call quality). Effective measurement programs look at both peak and sustained performance, vary measurement locations throughout a coverage area, and include repeat tests over time to capture daily and seasonal variation.
What metrics define connectivity and coverage?
Connectivity and coverage are often confused but measure related concepts. Coverage refers to where a service is technically available, while connectivity measures usable performance at a location. Key metrics include signal strength or link level indicators, service availability (percentage of time a user can connect), throughput (download/upload speeds), and coverage maps that combine measured signal and density of users. Coverage testing must include geographic sampling, indoor vs outdoor checks, and mapping to population or critical facilities to understand practical reach.
How do broadband, fiber, and satellite compare in metrics?
Different access technologies produce distinct performance profiles. Fiber typically offers high symmetrical throughput and low latency, while fixed broadband over copper or cable can show higher variability and asymmetric speeds. Satellite provides wide geographic reach but has higher latency and potential jitter, especially on geostationary paths; newer LEO constellations reduce latency but introduce other dynamics. When comparing, look at sustained throughput under load, latency distribution, and outage frequency rather than single-shot speed tests.
Why does latency matter for 5G and edge services?
Latency determines responsiveness for interactive applications and is critical for edge computing and many 5G use cases. Metrics to track include median and 95th percentile round-trip time, jitter (variation in latency), and tail latency events that disrupt real-time services. For 5G deployments, measuring latency end-to-end should include radio access network delays, transport and backhaul latency, and any processing delays at edge nodes. Low median latency combined with a tight tail distribution indicates consistent experience for interactive and control applications.
How do spectrum and infrastructure affect rural coverage?
Spectrum allocation and physical infrastructure are primary determinants of rural service quality. Lower-frequency spectrum propagates farther and penetrates buildings better, making it valuable for wide rural coverage, while higher bands provide capacity in denser areas. Infrastructure factors—cell site density, fiber backhaul availability, and power resilience—influence sustained quality. Rural measurement programs should assess coverage against population centers and key roads, and report metrics like reachable population percentage, typical speeds in villages, and required backhaul distances to maintain throughput.
How do backhaul and resilience influence service quality?
Backhaul capacity and redundancy shape how access performance translates into user experience. Insufficient backhaul causes congestion and sustained throughput drops even if last-mile links appear capable. Resilience metrics include mean time to repair, frequency of outages, percentage of traffic rerouted during failures, and capacity headroom (spare bandwidth). Monitoring should combine passive network telemetry with active probes to detect degradation early and quantify the impact of failover mechanisms and automated rerouting on service continuity.
How do security, automation, and edge systems impact measurements?
Security mechanisms (encryption, deep packet inspection, firewalls) can add processing overhead and affect throughput and latency; measurements should include tests with typical security policies applied. Automation—zero-touch provisioning and anomaly detection—can reduce repair times and improve measured availability, but it must be validated by tracking automation success rates and false positive rates. Edge deployments change where application processing happens; measuring from client to edge and from edge to origin clarifies where bottlenecks occur and helps prioritize improvements for lower latency and higher reliability.
Conclusion A practical service-quality framework blends network-layer metrics with application-level outcomes and contextual factors such as geography and infrastructure limits. Consistent measurement methodologies, transparent reporting of percentiles (not just averages), and attention to tail events give a more accurate view of real-world connectivity. For operators and planners, aligning capacity, backhaul, spectrum use, and resilience investments to measured user impact provides clearer priorities for improving everyday service quality.


